4. DETERMINATE ERRORS
4.1 THE NATURE OF DETERMINATE ERRORS
Indeterminate errors were introduced in Sec. 1.4 and 2.2 and determinate errors in section 2.3. Most of the preceding discussion of errors was devoted to indeterminate errors. This should not be taken to imply that determinate errors are not important. They are a constant source of trouble in experiments, and their detection and elimination may occupy a major portion of the experimenter's time.
While indeterminate errors show up clearly as scatter in data, determinate errors cannot be detected merely by a mathematical analysis of the data. A determinate error, if present, has constant magnitude and sign for all measurements of a particular quantity. Taking many measurements does not help either to detect or to eliminate the error.
Causes of determinate error were listed in chapter 1. They are:
(1) Miscalibration of apparatus. This can be removed by checking the apparatus against a standard.
(2) Faulty observation. This is avoidable, and therefore should not be cited as a source of error in any well-performed experiment.
(3) Unnoticed outside influences. These are also avoidable, but may be difficult to discover.
In principle all determinate errors are avoidable, but their presence is not always obvious. The first hint of a determinate error may come when experimental results are found to be inconsistent with each other by amounts larger than predicted by the indeterminate-error analysis. Even when only one result is obtained, it may be inconsistent with results obtained by other experimenters or with previously established theory, indicating a possible determinate error.
In the elementary lab the problem usually shows up as a discrepancy between the experimental value and the "textbook" value. If the discrepancy is much larger than the indeter- minate-error analysis predicts, it cannot be attributed to those error sources included in that analysis. One may suspect a blunder, and should then do whatever is necessary to identify it and conclusively show that it was the source of the trouble.
The cause may be an unrecognized determinate error. This should not be the end of the story, but rather the beginning of a thorough experimental search for the cause of the determinate error, and a demonstration that elimination of the suspected cause improves the result. Until this is done, any speculation about the cause of a "bad" result is only guesswork.
The physical or psychological causes of determinate error are, in principle, measurable. But if the cause was not suspected, the experimenter probably did not take the necessary measurements. One does not usually measure everything! The usual procedure is to design the apparatus so that unwanted influences are negligible. If this does not eliminate determinate errors, one then searches for them, or redesigns the experiment.
Psychological causes of determinate error, such as observer bias, may be extremely subtle, especially in observations of color, brightness, shape, behavior of fast-moving objects, etc. In physics we generally try to avoid such observations by using measuring instruments which require only reproducible visual measurements, such as reading a stationary needle on a meter scale, or geometric measurements on a photograph. Additional insurance of accuracy is provided by common sense, self-awareness, and gaining practice and experience in observational technique.
One should not regard any deviation from theory as being due to a determinate error. There is the possibility that the theory may be imperfect. This is one way deficiencies in a theory are discovered--when the experiment doesn't agree with theory.
4.2 DETECTION OF DETERMINATE ERRORS
No fixed rules can be given for tracking down determinate errors. Rather we will give one example of a general approach which is useful in some situations.
Assume that an experiment is performed which required taking data on quantities A, B, C, and D, used in the calculation of a result, R. The experiment is repeated a number of times, and many values of R are calculated, but the experimental scatter of the values of R is found to be larger than the predicted indeterminate error.
After thorough analysis of the experimental procedure, someone suspects that quantity E, not previously recorded, might be influencing the experiment. So the experiment is performed again, this time taking data on E (and perhaps on some other suspected quantities, F, G, etc.).
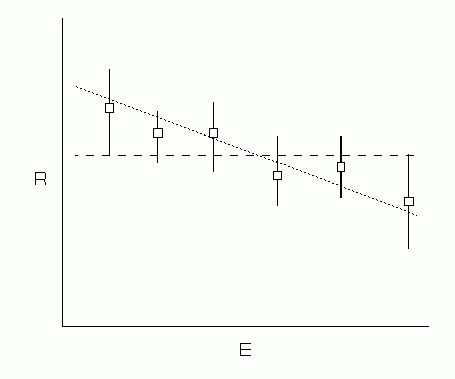
Now it is noticed that the largest values of R occur when E is smallest, and vice versa. To check the relation of R to E, a graph is constructed of R vs. E.

The error bars on the data points are those predicted by the indeterminate error analysis. The graph clearly shows that R is not constant, for the average R (dashed line) is not as good a fit as the slanting line (dotted line). It also shows the trend of R against E (the slanting dotted line), but more data might be required to determine the precise nature of this relation.
Finally one might try to hold E constant, or try to eliminate its influence entirely, to see if constant values of R result. One should at least show, by applying known theory, that the assumed mechanism causing the determinate error can actually give rise to a discrepancy of the size and behavior observed.
© 1996, 2004 by Donald E. Simanek.