P-2 STUDY OF EXPERIMENTAL UNCERTAINTIES
1. Read chapters 1 through 4 of An Introduction to Experimental Analysis before coming to laboratory.
2. GENERAL INSTRUCTIONS:
Several different experimental situations will be available in lab, each chosen to display rather large uncertainties so that the results of error analysis may be checked easily. You will study one or more of these situations, subject to the limitations of time, available equipment, and the desires of your instructor. The sections labeled "Analysis" may be completed in laboratory if there is time, or finished later as homework.
A. TRAJECTORIES
A-1. PURPOSE:
To study uncertainties caused by non-reproducible action of a mechanical system.
A-2. APPARATUS:
Spring gun, steel ball, 8 1/2 x 11 white paper, cardboard and carbon paper, meter sticks, clamp to hold gun firmly to table.
A-3. PROCEDURE:
A simple spring gun may be used to propel a steel ball horizontally from a table top. The ball initially rests in a depression in front of a spring-powered plunger, and the plunger may be drawn back to either of two positions. The position of impact of the ball with the floor may be conveniently marked by laying down a sheet of carbon paper (carbon side up) with a sheet of white paper taped down on top of it so it cannot move. when the steel ball strikes the paper it will leave a clear, black mark at the point of impact. Put a sheet of cardboard under all of this, to prevent the ball from denting or chipping the floor.
(1) The "range of a projectile" is the horizontal distance from the firing point to the point of impact. Determine how to set the ball and plunger to obtain the maximum range, and clearly state in your report how this was done.
(2) Place the recording paper at the point of impact, and fire the ball 20 times onto the same paper. Lay a one or two meter stick down from a point just below the firing point and extending along the floor in the direction of the line of fire. Draw a straight line along the stick on the paper, and mark a reference point on the paper so the distances of spots from the firing point may later be determined. Remove the paper from the floor and save it for analysis and inclusion in your report.
(3) Also measure the height of the firing point above the floor and estimate the uncertainty in this measurement. Before leaving this experiment, examine it for other sources of uncertainty.
A-4. ANALYSIS:
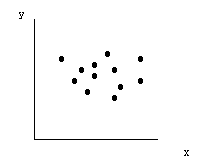
(1) The range of scatter of the spots on the paper may easily be determined by drawing a boundary around the spots. We seek some "average" of these scattered spots, some "central" value from which to determine an average value of the range, R. It is possible that the best average position will not be at the center of the range, if the main clustering is off-center. There may also be "spurious" points far removed from the main cluster.
 |
| Fig. 2. Scatter of data points. |
|---|
(2) The initial velocity of the steel ball may be determined by the formula:
vo = R √(g/2h)
where R is the range, h is the height of the firing point, and g is the "acceleration due to gravity", 9.807 meters/sec2. Calculate vo and its uncertainty, using the methods of chapter 3 of reference 1.
A-5. QUESTIONS:
(1) List, in order of importance, the physical causes of the scatter in the impact points. Suggest how these sources of uncertainty could be reduced.
(2) Write the determinate-error equation corresponding to equation (1). Write it in fractional-error form, for Δvo/vo.
(3) Which measurement (R or h) most affects the uncertainty in the calculated value of firing velocity? Which affects it the least? If the uncertainty in R were 5%, how accurately should h be measured to ensure that its contribution to the uncertainty of the final result is comparable to the contribution from uncertainty in R?
(4) If the uncertainty in h were 5%, how accurately should R be measured to ensure that its contribution to the uncertainty of the final result is comparable to the contribution from uncertainty in h?
B-1. PURPOSE
To study uncertainties due to inherent randomness of nuclear decay; uncertainties due to nature rather than to the limitations of measurement. To see how well the σ = √n rule holds for nuclear decay.
B-2. APPARATUS
Radioactive source (β or γ emitter), Geiger tube, holder for source and Geiger tube, scaler (electronic counter.)
B-3. THEORY
In the small-scale phenomena studied in atomic and nuclear physics, much of the experimental data comes from counting numerous events, such as the electrical pulses produced when charged particles pass through Geiger counters.
Nuclei emit particles, α, β and γ rays, at irregular intervals. Though one can't predict when the next particle will be emitted, the average rate of emission, measured over a large number of emissions, may be determined quite well.
The standard measure of the strength of a radioactive source is the average number of particles it emits per unit time, called the source activity, ΔN/Δt. The counting rate of a Geiger tube is the average number of particles it detects per unit time. If a source emits equally in all directions, the activity of a source may be easily determined from the counting rate of a nearby detector, and the geometrical solid angle from source to the detector's acceptance "window".
Advanced texts derive the fact that the distribution of the number of counts observed in a given time is a Poisson distribution, but if the number of counts is quite large, the distribution approaches a Gaussian one. We will study cases with small and large number of counts. The standard deviation in the number of counts, n, is σ = √n. We'll refer to this as the "square root of n" rule, and experimentally test its validity.
B-4. PRECAUTIONS:
(1) You will use a very weak radioactive source. Luminous watch dials (common before digital watches) were about as strong as this source. Those watches were worn on a daily basis; you will be using this source for only a couple of hours, so you need not be overly concerned about its safety. However, if you happen to wear one of these old luminous watches, keep it well removed from the experiment, for the detectors will respond to its radiation. In fact, if you have such a watch, you may use it as the source for this experiment if it will fit the detector chamber.
(2) Even though the radioactive source is weak, it is good to get in the habit of treating all radioactive sources with respect. Never put a source in your pocket, or anywhere where it might be out of sight and forgotten.
(3) Observe the detailed operating instructions posted near the scaler. In particular, note:
(a) The maximum potential the Geiger tube can tolerate.
(b) The fragility of Geiger tubes. Do not squeeze tubes with thin metal walls. Do not touch the thin foil or mylar ends of the end-window types.
(c) Be sure the voltage control of the power supply is set at its lowest setting during the four minutes required for tube-type power supplies to warm up. This prevents accidental application of too high a potential to the Geiger tube.
B-5. PROCEDURE:
(1) Remove all radioactive sources from the vicinity and visually observe the counting rate of the scaler. These counts are due to "background" radiation from the nearby surroundings, as well as from cosmic rays. Note particularly the irregularity of these counts. There are long intervals with no counts, then clusters of closely spaced counts. This is an illustration of the randomness present in all counting measurements, but it is easiest to see at low counting rates.
(2) Obtain a radioactive source from your instructor and place it in the holder below the detector. Find out how long it takes to accumulate approximately 100 counts. Now make a series of 20 counting runs, all of this same time duration.
(3) In the same way, make 20 more runs for a time duration long enough to accumulate about 1000 counts each time.
(4) If you have time, you might make a series of counting runs for intervals long enough to accumulate 10,000 counts each time.
B-6. ANALYSIS:
Consult Ch 5 of An Introduction to Experimental Analysis for the definition of standard deviation. Note in particular the efficient calculation method described in section 5. Many electronic calculators have the ability to total the sums and the sums of the squares simultaneously.
(1) For each part, 2 and 3, determine the counting rate for each of the 20 runs. Compute the standard deviation of each run, and for each part.
(2) Are the standard deviations of the data consistent with the s = √n rule?
B-7. QUESTIONS:
(1) If the standard deviation of n counts is Δn, derive the expression for the percent uncertainty in a run of n counts.
(2) How many counts should be accumulated in a run to ensure an accuracy of 1% in the counting rate?
C-1. APPARATUS:
 |
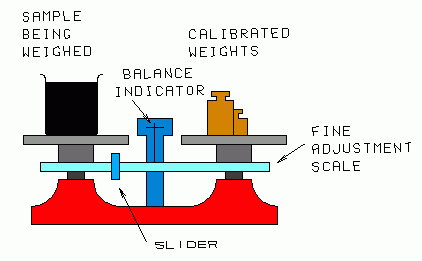
| Fig. 2. Trip (beam) balance. |
|---|
Metal cylinder, Vernier caliper, micrometer caliper, trip (beam) balance, standard weight set.
C-2. BACKGROUND:
Read "Precision Measuring Instruments" in this manual to learn how to use the micrometer and Vernier calipers.
C-3. PROCEDURE:
(1) Each member of your group should measure the dimensions of the metal cylinder several times, independently. To ensure unbiased results, each observer can keep the values secret until all measurements have been made. Do the values indicate that the measuring instruments are scale-limited? Assign an uncertainty estimate to each measurement, based on the scatter of the values.
(2) Write the equation for the volume of the cylinder, and its uncertainty equation. Calculate the volume and the size of its uncertainty.
(3) You are provided with a trip balance which measures in grams. Investigate the uncertainty of measurements made with this balance:
a) Move the rider (on the "gram" scale) all the way to the left of the fine adjustment scale. With no weights on the pans, the balance indicator should point to its zero (center) mark. If it does not, readjust the balance.
b) Balance a 1000 gram mass from your set against two 500 gram masses. You'd expect the scales to balance exactly. Do they? If not, try to determine whether the scales are at fault, or whether the masses are not accurate. This can only be done in a relative way, since no standards are provided. Be sure to look carefully for small imbalance—it may be only 1/10 gram or so.
c) Test other "equal" combinations of masses.
d) Now find the mass of the metal cylinder. Use no metric weights smaller than 10 grams; the scale slider is used for that range. Make several independent measurements with different observers. To assure complete independence, remove all weights from the pans, and move the slider to zero before each measurement.
(4) Write the equation for the density of the cylinder, and its uncertainty equation. Calculate the density and the size of its uncertainty.
C-4. QUESTIONS:
(1) A metal cylinder has a length of 4 cm and diameter 2 cm. What percent uncertainty is introduced into the calculated circumference by an uncertainty of 0.01 cm in the diameter measurement? What percent uncertainty does this introduce in the calculated volume?
Text and diagrams © 1997, 2004 by Donald E. Simanek.