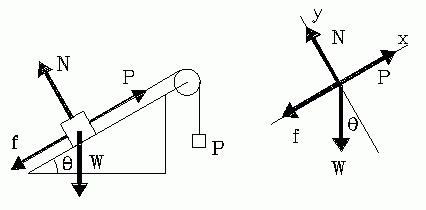
M-2 FRICTION AND THE INCLINED PLANEInstructor's notes. Here's an example of how the unruly data of this experiment can be systematically organized and analyzed. We will show only the static equilibrium case, but the same techniques can be applied to the dynamic cases as well. Following the usual notation, the forces acting on a body on an inclined plane are shown in the figure below, left. W is the weight of the body (W = mg), N is the normal force due to the plane, f is the frictional force, and P is the applied force present when a string is attached to the body to pull it up the plane. Generally this situation is analyzed by resolving the forces into components parallel and perpendicular to the plane, as shown in the figure below, right. The components of the weight are:
W = Wx sin θ
W = Wy cos θ
Suppose that the diagram represents a body W in static equilibrium, with the size of P adjusted until it is just on the verge of sliding up the plane. The free-body equations are:
P = f + W sin θ = μ N + W sin θ and
N = W cos θ Eliminate N, to get:
P = μ W cos θ + W sin θ Now this could be solved for μ:
But equation 5 gives us a clue for a strategy for studying the friction. We can rewrite it:
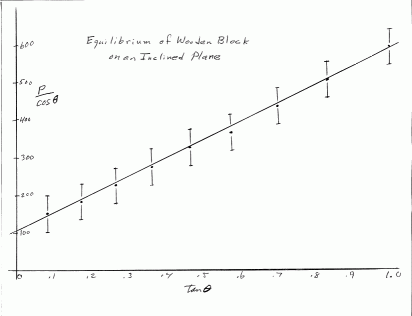
(P/cosθ) = W tan θ + μW . If we take data for P as a function of θ for a constant load, W, we can then plot (P/cosθ) vs. tanθ. We expect to get a straight line with slope W and intercept on the (P/cosθ) axis of μW.
Typical data:
Friction and the inclined plane.
Data from Jones, Urffer and Steinbacher. Lycoming College, Fall, 2004.

Load being pulled    W = 430.5
All forces expressed in gram-weights.

 Angle    Applied    T/cosA    tan(A)    Slope   Deviations from mean
 (deg)    force, T

    5        150    150.57     0.087
   10        180    182.78     0.176     362   116
   15        220    227.76     0.268     491    12.2
   20        260    276.69     0.364     510    30.7
   25        290    319.98     0.466     423    55.7
   30        320    369.50     0.577     446    32.8
   35        360    439.48     0.700     570    90.8
   40        390    509.11     0.839     501    22.5
   45        420    593.97     1.000     527    48.6

                                Mean:    479    51.2 Average deviation
                                                     from the mean.
The graph looks better than one might expect, fitting to a straight line very well. But the spreadsheet analysis (above) shows that the point to point slopes vary quite a bit. We hardly have enough data to justify a full-blown linear regression on this data. The calculations above reveal the average deviations of the individual slopes, and this is a good measure of the uncertainty in the average slope. So we conservatively express the average slope as 479 ± 51. Compare this with W = 430.5, measured by weighing the block and its load. The intercept (from the graph) is 105, which gives a value of 0.24 for the friction coefficient. Compare that with the value of 0.32 obtained from the angle of repose. Both coefficient of friction values have uncertainties on the order of 0.1 due to the uncertainty in the intercept resulting from uncertainty in the slope. So the agreement is good. One nice thing about error analysis in cases where the errors are large, is that simple and conceptually revealing techniques are sufficient. 6. QUESTIONS (1) Would the coefficient of friction of a 3-wheeled car be less than that of a 4 wheeled car, assuming the cars weighed the same, and the wheels were the same? Calculate the ratio of the values of friction coefficient in the two cases. Yes, it would be the same. (2) Consider the pulley at the top of the plane. How does the friction in the pulley depend on the tension in the string and the angle of the plane? State your assumptions clearly, and derive the equation for the pulley friction. The angle between the strings passing over the pulley decreases as the plane is tilted to higher angles. This increases the load on the pulley bearing, thereby increasing the bearing force due to friction. (3) The angle of uniform slip is that angle of the plane which causes the free block to slide down the plane with constant velocity. Show that this angle is given by
tanθ = μk where μk is the coefficient of kinetic friction. Constant speed is an equilibrium condition, where the net force on the body is zero. Therefore the proof goes exactly as the proof for angle of repose, only here the friction coefficient is the coefficient of kinetic friction. Text and drawings © 2004 by Donald E. Simanek. |

