PHYSICS LABORATORY REPORT
K-4 Projectile Motion.
Purpose:
To study the geometry of the ballistic trajectory of a steel ball shot from a spring gun.
Method:
A 1 cm diameter steel ball is fired from a spring gun at various angles of elevation, and the landing point is recorded.
Background:
|
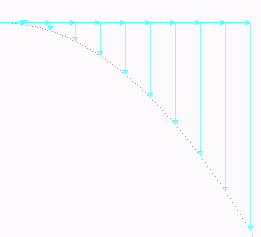
The displacement of a projectile fired with initial velocity vo is:
| [1] |
s = vo t + (1/2) g t2
where t is the elapsed time and g is the constant acceleration due to gravity. From this we may derive the formula for the horizontal range, R, of a projectile fired upward at anagle θ from level ground and landing on the same level:
| [2] |
R = (vo2/g) sin (2θ)
The indeterminate-error equation for equation 2 is:
| [3] |
Δvo/vo = (ΔR/R) + (1/2) (cos θ)(Δθ/θ)
The range for horizontal firing at an elevation of H above the ground is:
| [4] |
R = vo(2H/g)1/2
Error analysis:
The indeterminate-error equation for equation 4 is:
| [5] |
2ΔR/R = Δvo/vo + (1/2)(ΔH/H)
or:
| [6] |
ΔR/R = (Δvo/vo)/2 + (1/4)(ΔH/H)
Equation 6 results from application of the error-propagation rules to equation 4. However, this equation isn't complete, for it ignores the error in the setting of the angle θ = 0.
The general formula that includes firing height and firing angle is messy, and is given in the lab manual:
| [7] |
R = (vo2/2g)(sin(2θ) {1 + [1 + (2gH/vo2sin2θ)]1/2}
From equation 7, or from a geometric argument, both of which are messy, we can see that error in angle gives an additional contribution to the error in the range of size (R/2H)Δθ, so:
| [8] |
ΔR/R = 2(o/vo) + (1/4)(ΔH/H) + (R/2H)(Δθ/θ)
The Δθ and θ must, of course, be expressed in the same measure.
In our case, for firing horizontally, our values were
H = 81.3 cm ± 0.2 cm, or ± 0.2 %
R = 71.1 cm ± 1 cm, or ± 1%
Angle 0° ± 1° (± 0.17 radian), which contributes 0.8 %
In our case, the height error is negligible, but the error due to imprecision in measuring the firing angle uncertainty is comparable to that due to the firing speed uncertainty. But we are still overlooking the uncertainty in the firing angle of the ball leaving the gun. Actually we have a direct observation of that, in the lateral scatter of the impact points, where we found that the lateral uncertainty in the angle is (2cm)/(71cm) = 0.03 radian. This is about twice as large as the error of reading the angle scale. [This justifies the manufacturer's decision to not include a more precise angle measuring scale.]
This analysis suggests that the uncertainty in determining the firing speed, vo from the above data would be about (2%)/2 or 1%, conservatively.
Procedure:
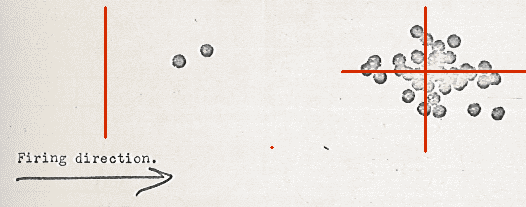
Horizontal firing.The spring gun was leveled, and fired 30 times onto a sandwich of white paper and carbon paper, so that a black dot was recorded at each point of impact. The scatter of these points was due to variability in the velocity and angle of release of the ball from the gun, giving us an estimate of the experimental uncertainty in the projectile's range. For horizontal firing from a height of 81.3 cm, the mean range was found to be 71.1 ± 2 cm. We are using average deviation as the measure of uncertainty.
 |
The scatter record is shown above. The left red line is 60 cm from the firing point. The mean of the distribution is where the other two red lines cross, 11.1 cm from the left red line.
Result: The firing velocity was calculated to be 584 ± 11 cm/s.
| ||||||
Firing at an angle upward: Here the purpose was to investigate the variation of range with angle.
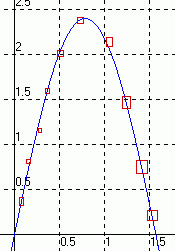
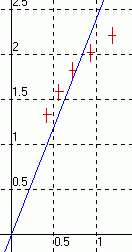
Result: As expected from equation 2, the plot of range vs. angle was a cos(2θ) with a peak very near 45°. A plot of range vs cos(2θ) would therefore be expected to be a straight line passing through the origin. However, we found this was not so, for we got a curve indicating that the range was smaller than expected at larger angles.
Graph 2 shows that the data points cannot be fitted to a straight line through the origin for it cannot be drawn to pass within the uncertainty ranges of the data points. A smooth curved line would be more appropriate (not shown).
Two reasons might account for this, but these are merely speculative until a focused investigation is performed. (1) The gun may release the ball with lower velocity when it is aimed upward. (2) The ball is in the air for longer times when the range is larger, giving more accumulated velocity loss due to air friction.
The uncertainty in the range is consistent with the assumption that the firing speed has negligible variation, while the angle of ejection of the ball from the gun has a range of angles, in all directions, of about 0.03 radian (1.6°).
Questions:
1. Why should a smooth curve be drawn in the R vs. θ case but a straight line in the R vs. sin(2θ) case?
We want to see how well our data fits the relation R = (vo2/g) sin (2θ). In view of the inherent uncertainties of the data, a straight line could not possibly fit in the first case, and therefore would be unjustified. In fact, our data shows that a straight line isn't justified in the second graph either. The straight line is superimposed on this data just to compare the formula prediction [equation 2] with the actual experimental situation.
2. How do errors in the measurement of R and θ contribute to the error in the vo calculation.
R is responsible for a 1% undertainty and θ is responsible for 0.8% uncertainty in vo.
3. At what angle do you observe the maximum range?
At 43 ± 4 °. In the absence of air drag, one expects 45°.
4. Do the two determinations of vo agree?
No. They differ by more than their individual uncertainties. There must be other influences we had not included in our error analysis, or we made a blunder.
Appendices:
Appendices attached include original data sheets, sample calculations, and a geometric analysis of the error due to angle uncertainty.


