W-2 VIBRATING STRINGS
1. PURPOSE:
To investigate standing waves in a string, and discover relations between measurements made on the string.
2. APPARATUS:
Long string, electrically driven vibrator, pulley, weights, weight hanger, analytic balance.
3. BACKGROUND:
Read theory (3) of experiment W-1. The terminology of standing waves also applies to the vibrating string, the string being the medium. The wave has a particular velocity as it moves down the string, but this velocity might depend on the properties of the string, its mass, rigidity, tension, etc.
 |
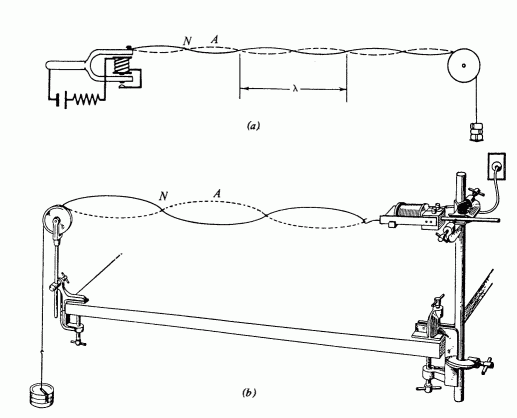
| Fig. 1. Vibrator driving taut string. [Bernard and Epp] |
|---|
The string will be horizontal, with one end attached to the vibrator, and the other passing over a pulley to a weight hanger. Addition of weights to the hanger will vary the string tension. At some particular values of tension, standing waves are observed in the string. The point where the string passes over the pulley is not exactly a node, and the end attached to the vibrator is generally quite far from an antinode. Whenever possible, measure a distance between nodes which can be unambiguously located. The wavelength is twice this distance.
The amplitude of the string's vibration may be measured approximately. Measure every relevant quantity you can find, over as wide a range as possible. The mass per unit length of the string is found by measuring a long length and weighing it with an analytic balance.
Note that tension may be varied over a considerable range without destroying the standing waves—only shifting the wavelength. But for some values of tension the string never settles down into a stable pattern. Can you discover any reason why this happens? Is it related to any of the measured quantities?
The accuracy of the frequency is the same as the accuracy of the power line frequency. This is better than 1 part in 10 anywhere in the United States.
You grade will depend on the thoroughness of your investigation and the completeness of your report. Do not limit yourself to the questions asked above. Graphs of the data will help you discover relations. Construct such graphs as you are taking data, for they will reveal where you need more or better data to draw conclusions. Include such graphs whenever possible, choosing appropriate variables, include them in your report, and express the results as equations.
4. REPORT:
In addition to the usual items, this report will require an extended discussion of the theory, observations, and particularly, the conclusions.
© 1997, 2004 by donald E. Simanek.