E-8 LRC CIRCUITS
1. PURPOSE
To study circuits with reactive elements and to learn how to predict relations between current and voltage readings with AC meters.
2. APPARATUS
Inductor of size between 5 and 10 henry.
Capacitor of size near 0.01 microfarad.
Resistors: 10K and 100K.
Signal generator or audio oscillator.
AC meter, VTVM or FET multimeter.
Oscilloscope.
3. THEORY
The theory of AC circuits may be found in any general physics textbook. Here is a summary of the information you will need, and need to understand.
REACTANCES:
Resistor, XR = R
Capacitor, XC = 1/2πfC
Inductor, XL = 2πfL
AC rms, peak, and peak-peak meter readings are in proportion:
Vrms = 0.707Vp
AC current is instantaneously the same through elements in series.
AC potential is instantaneously the same across elements in parallel.
Instantaneous values of current and potential obey Kirchoff's laws. AC meter readings (rms, peak, or peak-peak) combine vectorially.
4. PROCEDURE
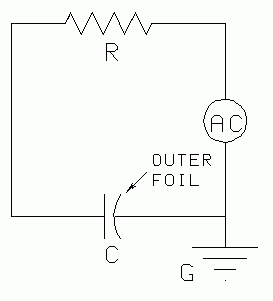 |
| Fig. 1. Capacitor and resistor in series. |
|---|
(1) Connect the audio signal generator, 10K resistor and 0.01 microfarad capacitor as shown in Fig. 1. The capacitor's outer foil (its marked end) should be connected to the `low' or `ground' terminal of the signal generator to minimize pickup of unwanted environmental interference signals. (The predominant unwanted signal is likely to be the 60Hz radiation from the building power lines.)
Set the signal generator frequency to 1000 Hz, and the output potential level at any convenient value, say 5 volts.
(2) Measure potentials across source, resistor, and capacitor. Notice that they do not `add up' like numbers. But if you add the capacitor and resistor voltages as vectors at angle 90° the resulting vector's size is nearly equal to the source potential. Check this.
(3) Do the same for other frequencies. Since we expect a reciprocal relation between capacitance and frequency, take frequency values something like 200, 250, 350, 500, 1000, 2000 Hz, so that their reciprocals will be approximately equally spaced on a graph.
(4) For each frequency, calculate the ratio of capacitor to resistor potential. Theory would predict that
| [1] |
V    X
 C    C     1
—— = —— = —————
V    X    2πRfC
 R    R
Plot this potential ratio vs. reciprocal of frequency (or vice versa). See if the slope correctly relates to 2π. Comment on any discrepancies.
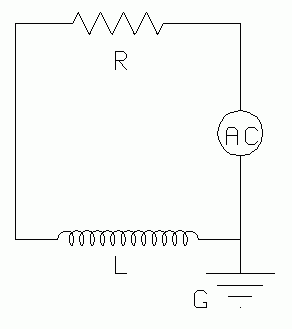 |
| Fig. 2. Inductor and resistor in series. |
|---|
(5) Connect a circuit with the inductor and the 100K resistor as shown. Repeat the procedure of steps (1) and (2). Calculate the inductance, L.
(6) Do the same for frequencies of 300, 600, 1K, 13K, 16K, and 20K. Theory would predict a linear relation between inductor reactance and frequency, so
| [2] |
V    X
 L    L   2πfL
—— = —— = ————
V    X     R
 R    R
Calculate the ratio of inductor to resistor potential for each frequency. Plot this ratio as a function of frequency. Does its slope correctly relate to 2p? Comment on any discrepancies.
(7) Theory predicts that the capacitor potential is shifted 90° with respect to the current and the inductor potential is shifted 90° with respect to the current, but in the opposite sense to the shift of the capacitor. So, in a series circuit, the capacitor and inductor potential are 180° out of phase with each other, adding like two oppositely directed vectors, as shown in Fig. 3. Therefore there is a frequency at which these two opposing vectors are the same size, and add to zero. This is called the resonant frequency, which is easily predicted to be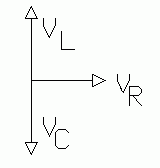 |
| Fig. 3. Resonance. |
|---|
| [3] |
        1
2πfL = ———— .
       2πfC
So:
| [4] |
      1
f = —————
    2π√(LC) .
(8) Predict the resonant frequency for the capacitor and inductor in series with the resistance. Connect them as shown in Fig. 4, with either one of the resistors. Measure the potentials across each element. Also measure the potential across the capacitor-inductor combination, as shown. Sweep the frequency of the signal generator until the voltmeter reads a minimum. (It won't read zero, since the inductor has resistance.) How well does this experimentally determined resonant frequency agree with your prediction?
(9) In the spirit of the above procedure, devise a method to measure the resistance of your inductor with a reasonable (better than 20%) precision. Ask your instructor for any equipment you may need.
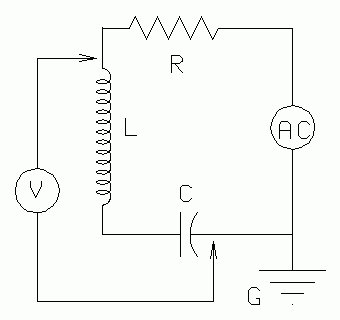 |
| Fig. 4. Series LRC. |
|---|
(10) Predict the ratio of potentials across capacitor and resistor when your inductor and capacitor are connected in parallel, and the resistor is in series with the source, as shown below. Use a frequency of 1K Hz. Remember that for a parallel combination, the vectors that add have lengths proportional to the reciprocals of the reactance, and the vector sum is the reciprocal of the impedance. What is the resonant frequency in this case? Check your prediction experimentally.
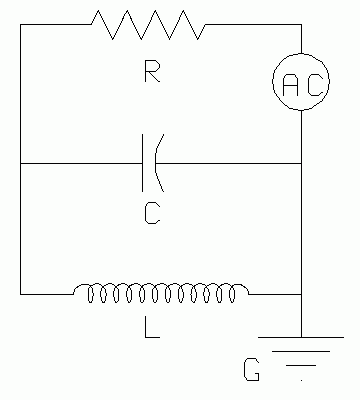 |
| Fig. 5. Combined series and parallel LRC circuit. |
|---|
Text and drawings © 1989, 2004 by Donald E. Simanek.