EL-1 USE OF THE OSCILLOSCOPE
1. PURPOSE
|
To become familiar with the cathode ray oscilloscope and its uses.
2. APPARATUS
A cathode ray oscilloscope with triggered sweep and X-Y operation mode. Signal generator or function generator. Multimeters.
3. REFERENCES
These instructions are intended to be sufficiently complete that you may not need to consult the equipment operation manual, but you should at least look at the manuals during the lab period to see what kind of information it contains. You may need this information in future applications.
Before coming to laboratory, consult your textbook to find out about the following topics: period, frequency, angular frequency and phase of sine waves; Ohm's law; formulae for electrical power; use of voltmeters and ammeters; cathode ray oscilloscope (theory and uses); electrical safety precautions [ask for a handout sheet on safety if your textbook has insufficient information]; calculation of power in ac circuits; impedance and reactance; harmonic analysis.
Consult your textbook to find definitions of the following terms: potential (voltage); current (amperage); power (wattage); phase angle; rms (root mean square) average (of voltage, current, etc.); attenuation; resonance; impedance; reactance; cathode ray tube; angular frequency; harmonic series; fundamental; harmonics; overtones.
4. INTRODUCTION
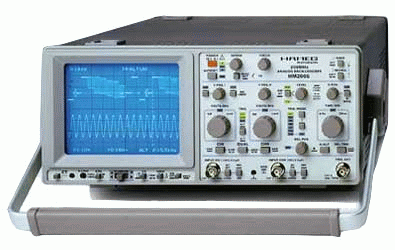
The oscilloscope (or 'scope') is a device which displays a graph of an electrical signal on the face of a cathode ray tube (CRT). This is usually done by displaying a time-varying potential (voltage) on the vertical axis (Y), and time on the horizontal axis. This is called the Y-T mode. Most oscilloscopes also allow the horizontal axis to be driven with another time- varying potential. In this mode, the horizontal axis is called the X axis, and this is called the X-Y mode of operation.
The CRT has much in common with computer monitors and the picture tubes of TV sets. A hot wire filament heats a metal cathode which then emits electrons. These electrons are accelerated by a high potential (typically 10 kV), collimated into a narrow beam and focused to a small spot on the front surface of the CRT. They give up their energy to the atoms in the phosphor coating on the front of the tube. These excited atoms quickly give up that energy in the form of light. Thus the small spot struck by the electron beam gives off visible light.
The beam is 'aimed' at a particular spot on the phosphor screen by two pair of electrostatic deflection plates, one set to deflect the beam up or down and the other to deflect the beam right or left. The deflection plates' potentials are controlled by the output of two independent electronic amplifiers. We'll refer to these as the 'vertical' and the 'horizontal' amplifiers.
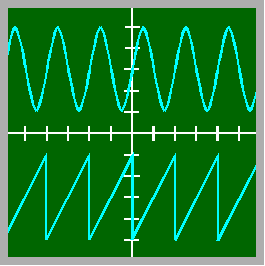
To observe the time variation of a signal, the signal is input to the vertical amplifier while the horizontal amplifier is driven by a sawtooth wave generator (within the oscilloscope.) The sawtooth generator drives the electron beam horizontally (left to right) at a constant speed, then quickly returns it to the left to sweep again. The right-to-left motion is usually so rapid that they eye cannot follow the motion, and only the left-to-right sweep is seen. The phosphor coating of the screen has 'persistence' which causes it to glow for a short time after being excited. The persistence of the screen and the persistence of human vision combine to produce a flicker-free illusion of a continuously traced graph.
Both the vertical and horizontal amplifiers have precisely calibrated gain (amplitude) controls which make it possible to determine potentials and time intervals accurately from measurements on the face of the CRT.
The sweep generator of older oscilloscopes can only be adjusted in frequency. It is often tricky to stabilize the screen display of such a scope. More sophisticated oscilloscopes also have a 'trigger' mode in which the sweep is initiated (triggered) by an electrical signal. One can choose whether the triggering signal is INTERNAL (taken from the waveform itself), or from an EXTERNAL signal. Usually one can set the sign and size of the voltage required to trigger the sweep. Some even allow you to choose to trigger on voltage level or on the slope of a waveform. Most modern oscilloscopes have a triggered mode.
An oscilloscopes' horizontal deflection is generally driven by the internal sawtooth signal from a `timebase' generator. But oscilloscopes generally also have some provision to deflect the beam with an external signal.
Modern oscilloscopes often have two independent amplifiers which may be used simultaneously. Each is called a `channel' and such a oscilloscope is a `dual channel' oscilloscope. Dual channel oscilloscopes can display two different signals simultaneously on the screen, and may have the capability to display their sum or their difference.
5. PROCEDURE
(1) See that your lab station has a complete set of the required apparatus.
(2) Find the INTENSITY (or BRIGHTNESS) control, and set it about midway of its range. This controls the intensity of the electron-beam's trace on the screen.
(3) Find the POWER ON switch on the oscilloscope. Very often it is combined with one of the other controls, usually the SCALE ILLUMINATION control. Plug the oscilloscope's power cord into an AC outlet and then turn on the POWER switch. It may take a minute or so before you see anything on the screen, since the filament of the CRT (cathode ray tube) needs time to heat up. After several minutes, if you see nothing on the screen, advance the INTENSITY control gradually until a spot or line is seen on the screen. Avoid excess intensity, for that can permanently `burn' the phosphor coating on the screen. The beam's trace should be just bright enough to be clearly seen. Excess brightness spreads the trace and decreases resolution.
(4) If you don't see anything on the screen, check:
(a) The position controls may be set too high, low, right, or left. [See step (5)]
(b) Beam intensity may be set too low. [See step (3)]
(5) If the oscilloscope has two channels, select (with the MODE switch) channel A to display on the vertical axis. Put the oscilloscope in the AUTOmatic TRIGGERing mode. Set the triggering mode to INTERNAL, to trigger on the channel you wish to display (channel A).
You may need to adjust the TRIGGER LEVEL control to stop the screen waveform from moving left or right on the screen.
(6) Find and test the VERTICAL POSITION controls of the vertical amplifier, which move the beam up or down. Find the HORIZONTAL POSITION control which moves it left and right. [Some oscilloscopes have `beam finder' buttons which give you a clue which direction the beam is when it is `off-screen.'] Make sure these controls allow you to move the beam anywhere on the screen. (7) Once you have achieved a stable line on the screen, find the SWEEP RATE or TIMEBASE control. It should have at least one setting for external input to the horizontal axis. Choose that setting. This usually defeats the horizontal sweep, since you aren't supplying an external signal. If it doesn't, look for a sweep off switch or control. You want to see a stationary spot of light on the screen (not a line) for the next adjustments. Turn the BEAM INTENSITY to a lower value to avoid damaging the phosphor coating of the screen.
(8) When you see a visible stationary spot on the screen, move the beam to the center of the screen. Find the FOCUS and ASTIGMATISM controls. The focus control changes the size of the spot; the astigmatism control changes its shape. Increase the spot size slightly, using the focus control. Then make it round with the astigmatism control. Refocus to reduce its size to the smallest point.
(9) Now set the sweep control to restore the horizontal sweep. This control is usually marked in time units/length unit, for example, 1 ms/cm, which means that the beam sweeps horizontally at one cm/millisecond"the same as saying that the beam takes one millisecond to sweep one centimeter. Try the slowest sweep rate settings first, so you can see the spot of light moving across the screen. If the oscilloscope is a good one, this spot moves at constant speed. Now try higher sweep rates, and notice that the screen has persistence, meaning that the phosphor glows for a brief time after the beam has excited it. Some oscilloscopes have high persistence screens to allow very brief events can be seen (or photographed).
(10) Turn on the signal generator (or function generator) and set it to produce sinusoidal waveforms. Set its range switch (or button) and frequency control to produce a frequency of 1000 Hz. Set the oscilloscope's horizontal sweep to something like 1 ms/cm. Set the oscilloscope's vertical gain switch so that this signal will not exceed the limits of the screen.
(11) Connect the shielded cable from the generator to oscilloscope, and check your prediction. The waveform should be displayed at rest on the screen, not moving left or right. You may have to experiment with the TRIGGER VOLTAGE, SWEEP, and SYNChronization settings to achieve this. Be sure to have the oscilloscope set for TRIGGERED SWEEP.
(12) Experiment also with the VERTICAL GAIN and HORIZONTAL GAIN controls.
(13) Experiment with different sweep rate settings. Try different frequency settings of the signal generator, over its full range, always resetting the oscilloscope sweep so that you can see the shape of the sine waves. Is the wave shape preserved over the full range of the generator, or is it distorted? If it is distorted, which is at fault, the generator, or the oscilloscope? [You may need to discuss this with your instructor if you do observe distortion.]
6. CALIBRATION
(14) See whether your oscilloscope has an internal CALIBRATION signal. Typically this is a square wave of 60 or 1000 Hz frequency with a calibrated peak-to-peak voltage. Use this to check both the vertical calibration and the time-base calibration of your oscilloscope.
7. MEASUREMENTS WITH THE OSCILLOSCOPE
|
(15) If you have a function generator which can generate 'square' and 'triangle' waves, try them. These are a more severe test of the frequency response of the oscilloscope, and you may see distortion at high frequencies. This is why such waveforms are often used to test for distortion in high fidelity sound equipment.
(16) If a loudspeaker or headphone set is available, connect it to the function generator output and listen to the waveforms. Notice that there's a difference in quality of the sounds made by different wave shapes, even when the frequencies are the same. In musical terminology, the sine wave is a single frequency `pure' tone, with no harmonics. The triangle wave produces a fundamental and odd numbered harmonics. The `square' wave produces a fundamental and all (odd and even) harmonics.
(17) Turn down the gain of the function generator, and connect a diode across its output terminals. The diode conducts current only in one direction. Now advance the gain setting of the generator, and observe the shape on the screen while listening to the sound. If you have an ear sensitive to musical differences, you will notice that the sound is not a `pure' tone, but seems to be a mixture of at least two tones, one octave apart (a frequency ratio of 2:1). The diode produces severe distortion of the sine wave, of a kind called `second harmonic distortion.' This distortion produces a mix of fundamental at frequency f (first harmonic) and a first overtone (second harmonic) at frequency 2f. It also produces higher harmonics, but these are weaker.
|
(18) Simultaneously measure the voltage of a 1000 Hz sine wave with a multimeter and the oscilloscope. The multimeter probably gives an RMS average reading. You can determine the peak and peak-to-peak readings from the oscilloscope screen. Are these in the expected ratio [RMS = 0.707 PEAK]? If not, the oscilloscope's vertical axis, or the multimeter, may be incorrectly calibrated.
Calibration of the oscilloscope's vertical axis may be done in several ways. (a) The oscilloscope may have a built-in calibration signal for this purpose. (2) An accurate DC reference source may be used, with the oscilloscope set for DC input.
(19) When calibration is complete, compare the meter's potential readings for square and triangle waves. You should not expect the ratios to be 0.707. What do you expect?
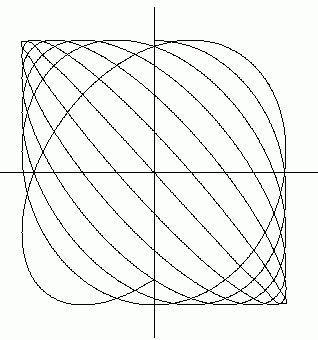
(20) Lissajous figures. [Pronounced lissa'joo] Most oscilloscopes have both an X and Y axis input. This is convenient for direct comparison of frequencies. Use two signal generators to observe this, one to the X input and one to the Y input. When they have the same frequency and amplitude, the oscilloscope's beam should orbit around a perfect circle or ellipse on the screen. [If the relative phase is just right, you may see a tilted straight line.]
If the two frequencies are slightly different, the pattern will not 'stand still.' If the frequencies are in exactly integral ratio, you'll get stable, pretty patterns called Lissajous figures. The ratio of frequencies can be 'read off' the screen by counting `loops' of the pattern on the vertical and horizontal axes. Do this.
 |
 |
| Ratio 2:1. | Ratio 3:1. |
|---|
 |
 |
| Ratio 3:2. | Ratio 11:1. |
|---|
(21) DC Measurements. The oscilloscope may also be used for DC measurements; and calibrated external DC voltages may be used to calibrate the scope. The input amplifiers each have a switch which has a DC and AC setting. The AC switch position puts a capacitor in series with the input. The DC switch position usually is a direct input to the amplifier (no capacitor).
Obviously the sweep function of the oscilloscope is not necessary here, and could be turned off. But it may be easier to read the displacement on the screen if it is left on. Be sure to always measure the vertical displacements at the same horizontal displacement on the screen, just in case the sweep line is not exactly horizontal.
Use the DC input to measure the voltage of a '1.5 volt' cell. Use it to measure a mercury cell. Because of the very high input resistance of the oscilloscope (megohms) it approaches the 'ideal' voltmeter, and DC measurements of cells are very close to the cell emf.
APPENDIX
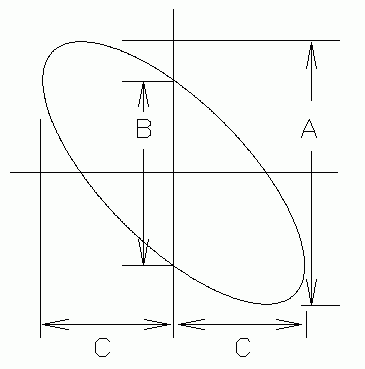
The phase relation between two sine waves of the same frequency may be measured with an oscilloscope.
Let one of the sine waves drive the vertical amplifier, and the other drives the horizontal amplifier. Let y be the vertical axis and x be the horizontal axis of the display.
Accurately center the ellipse on the scope's display screen, so that the two distances labeled C are exactly equal. It is not necessary to center the display vertically to make the measurements, but for the purposes of the mathematical derivation we assume that it is vertically centered.
Representing the phase angle between the two sine waves by φ, the x and y coordinates of points on the ellipse are given by:
 |
| Determining the phase angle. |
|---|
y = a sin(ωt + φ)
= a [sin(ωt)cosφ + cos(ωt)sinφ]
x = b sin(ωt)
The maximum value of y is a.
When x = 0, then
sin(ωt) = 0, and cos(ωt) = 1,
so y = a sin(φ),
and y/a = sinφ
On the diagram:
B = 2b and A = 2a
so,
B/A = sin(φ)
Referring to the diagram, we see that just two measurements, A and B, from the screen are sufficient to determine the phase angle, φ.
Text © 1995, 2004 by Donald E. Simanek.


