EL-2 RECTIFICATION: SEMICONDUCTOR DIODES
I. PURPOSE
To investigate diode circuits, in particular those circuits which are useful for rectification: the conversion of alternating currents to direct currents.
II. a) EQUIPMENT
Oscilloscope and cable or probe.
Function (signal) generator, output 0 to 20 v p-p.
Component board with the following components mounted on it:
- Four signal diodes
Load resistor, 1kΩ
10Ω resistor (for filter)
30mF, > 30v electrolytic capacitor (for filter)
II. b) COMPONENT BOARD LAYOUT
Note that the diodes are mounted on the component board so that two have opposite polarity direction from the other two. The color stripe(s) on the diode indicate the positive' end.
The symbol for the diode is:
 |
| Fig. 1. Diode symbol and device marking. |
|---|
The arrow of the diode symbol indicates the direction in which current experiences the least resistance (a fraction of an ohm), called the 'forward' direction. In the reverse direction the resistance is very much higher (but not quite infinite.)
The 1kΩ resistor, R, will be used in some parts of this experiment as a 'load' for the output current. You will connect the oscilloscope across this resistor to observe the potential drop across it.
 |
| Fig. 2. Component board layout. |
|---|
III. THEORY
a) DIODES.
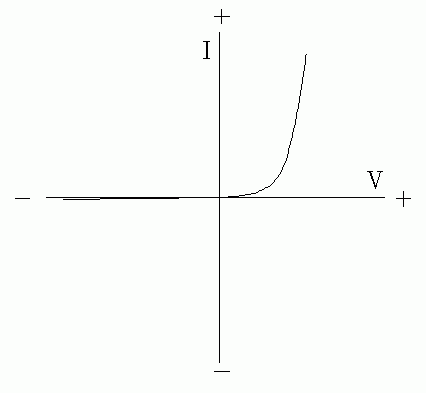 |
| Fig. 3. I vs. V characteristic curve of a diode. |
|---|
A diode is a non-ohmic two-terminal device. Its resistance is not constant, but is a function of the diode's current. Fig. 2 shows the relation between diode voltage and current, the characteristic curve of the diode.
The diodes used in this experiment are solid state junction diodes. They allow easy passage of current in one direction while blocking current in the reverse direction. When diodes are used to convert AC to DC, the process is called rectification.
The diode's characteristic curve is very different for the two directions of current. In the forward direction of current, the resistance is very low. [The conduction threshold in the forward direction is approximately 0.2 volt for germanium diodes and 0.6 volt for silicon diodes, at room temperature.]In the reverse direction of current, the resistance is very high, so high that there is practically no conduction in that direction. [If the reverse voltage is high enough, the diode begins to conduct in the reverse direction. This 'Zener' threshold voltage is used in specially designed diodes for voltage regulation. In this experiment the reverse voltages do not reach the Zener breakdown voltage, so we can assume that no significant conduction occurs in the reverse direction.]
The resistance of the diode is the slope of the V vs. I curve, that is DV/ΔI. It is not simply V/I, since the voltage is not a linear function of I. Diode curves are usually shown as I vs. V, so be careful to interpret the slope correctly.
In the preliminary design and analysis of a circuit, it is helpful to think of each diode in the circuit as capable of conduction only in the direction of the arrow of its symbol, and not capable of conduction in the reverse direction. If an alternating voltage is applied to the circuit, consider each half-cycle separately. During each half cycle the voltage source supplies current in one particular direction. Draw all conduction paths for that situation. Then consider what happens when the source supplies current in the opposite direction. Draw all conduction paths for that case, using a different color of pencil or ink.
b) RECTIFICATION, HOW IT WORKS
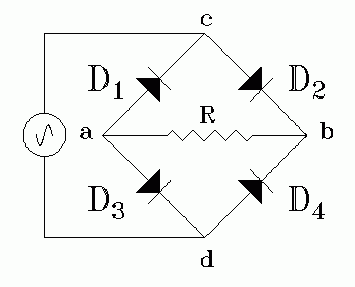 |
| Fig. 4. Bridge rectifier circuit. |
|---|
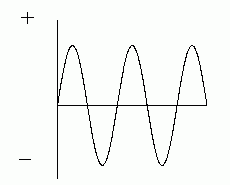
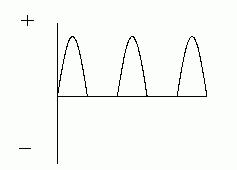
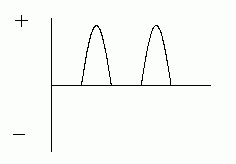
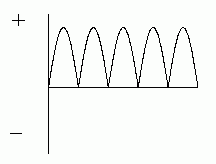
Fig. 4 shows a full wave rectifier circuit. The signal generator produces a sine wave whose polarity (positive or negative) changes sign each half cycle. When the direction of the current is from the generator into the bridge at point c, the only available current path through the bridge is cbad, through the resistor from right to left in the diagram. During the next half cycle, the current direction is from the generator into the bridge at point d. Then the only available path is dbac, but again the current direction is from right to left through the resistor. Therefore the current through the resistor always has the same direction, as shown in the plot (d) below.
| ||||||||
| Fig. 5. Principles of rectification. |
|---|
 |
| Fig. 6. Rectangular layout of the bridge circuit. |
|---|
Fig. 4 showed the 'diamond' representation of the circuit. Fig. 6 shows the same circuit in 'rectangular' form:
The circuit of Fig. 6 is electrically identical to that shown in Fig. 4. [Label each diode and junction of both diagrams to convince yourself that this is so.] The 'diamond' form of the circuit diagram avoids cross-over wires, but the rectangular form may more clearly reveal what is going on.
For example, in the rectangular diagram it is easy to see that if the middle two diodes are removed from the circuit, the circuit becomes a 'half-wave' rectifier. The middle two diodes act to route the alternate half cycles to the load in the correct direction. Which two diodes do these correspond to in the diamond form of the circuit?
IV. EXPERIMENTAL PROCEDURE
In all parts of the experiment the diode circuit is connected to 60 Hz sinusoidal AC voltage from a signal generator, 3. The diode circuit modifies this wave in various ways. You will observe the output waveform with an oscilloscope. In all cases the 1KW resistor R acts as a load for the output power, and the oscilloscope monitors the voltage across the load.
The potential across the load is, of course, proportional to the current through the load, and the current is the quantity of interest. This is a good example of the use of a high impedance voltmeter (the oscilloscope) to measure a current through a known resistor. The oscilloscope's internal input resistance is many megohms, much larger than 1kW, so its effect on the circuit is negligible.
The scope amplifiers should be used in DC mode rather than AC. In the AC mode the signal passes through a capacitor, which blocks DC, losing the DC levels you wish to measure. Also, the AC input has capacitance which can introduce some distortion of the flat portions of the rectified waveforms.
A. Half-wave Rectification.
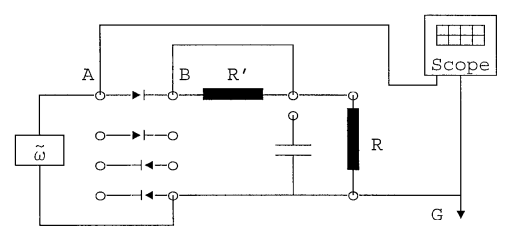
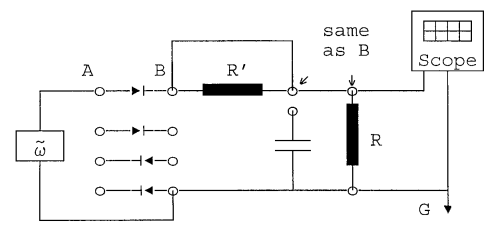
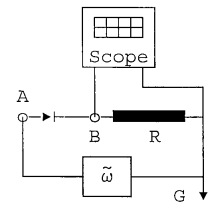
(1) Connect wires to the circuit board as shown in Fig. 7a. The signal generator, 3, is at the left of the diagram, the oscilloscope is at the right. All connections to the oscilloscope are made to one of its vertical inputs. Be sure that the chassis ground lead of the oscilloscope has a direct path to the chassis ground lead of the signal generator. The 'ground' symbol, , is shown in the diagrams to remind you of this. It is not necessary to earth-ground this circuit. In most parts of this experiment you will measure voltages at various points with respect to this ground.
Some components on the board are not used in this circuit: The capacitor and three of the diodes are not 'in' the circuit, and the resistor R' is not functional because of the jumper wire shorting it out. These components will be used later.
Set the signal generator to produce sine waves of 60 Hz frequency. Adjust the amplitude of the generator so that the height of the waveform on the oscilloscope screen fills more than one-half of the screen, and is approximately 15-20 volts peak-to-peak.
 |
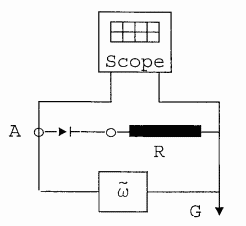 |
| Fig. 7a. Circuit board connections. | Fig. 7b. Circuit diagram. |
|---|
If you have a dual-channel oscilloscope you can leave this connection from terminal A of the function generator to scope channel input A in place. Then use scope channel B to display waveforms at other points of the circuit, as specified in subsequent steps. You will then see two waveforms on the screen simultaneously, for easy comparison.
 |
 |
| Fig. 8a. Circuit board connections. | Fig. 8b. Circuit diagram. |
|---|
If you have an oscilloscope in which an external signal may drive the horizontal beam deflection, you may replace the next part (3) with the procedure described in section D below.
(3) Set up the oscilloscope to make calibrated voltage readings (V/cm) on the vertical axis of its display grid. Measure and record the peak voltage at points A and B for ten or more different voltage settings on the signal generator. Be sure to include some small voltages, less than one volt. In this way you can check whether your diode has an I/V relation like that of Fig. 3. (4) Use your VA vs. VB data to plot the I/V characteristic curve of your diode.
B. Full wave rectification.
IMPORTANT NOTE: In the following sections, B and C, the ground leads of the oscilloscope and the signal generator must not be connected in common. If both instruments have one of their terminals internally connected to the electrical 'safety' ground, then they will 'short out' part of this circuit. Look to see if either instrument provides a simple way to eliminate this ground connection. If not, then the solution is to 'lift' the safety ground of the power cord of the signal generator. Use a 'grounding adapter', but leave its ground tab (or green lead) uncon- nected. Consult your instructor before doing this.
(8) Set up the bridge rectifier circuit as shown in Fig. 9. Sketch the output waveform and explain it.
 |
| Fig. 9. Bridge rectifier connections on circuit board. |
|---|
We have drawn arrows on the circuit showing the current paths during one half-cycle. The top and bottom diodes carry no current in this half-cycle. Why? Using a colored pen, indicate the current paths for the other half-cycle, when the current is directed up through the generator.
C. Filtering. (9) Add the filter circuit as shown in Fig. 10, with R- = 10 W, C- = 30 mF, and R the same as before, 1 KΩ. The polarity applied to the capacitor must match that marked on the electrolytic capacitor, for if the capacitor is connected 'backwards' it will not have its rated value of capacitance, and, worse, it may be destroyed. [If the voltage across an electrolytic capacitor is high enough, and reversed in polarity, the capacitor can overheat and release gases explosively.]
Sketch the observed waveform. Indicate in the sketch the peak-to-peak amplitude of the AC component of the wave form. Compare this with the corresponding measurement in procedure step 8 (without the filter).
 |
| Fig. 10. Full wave rectifier with RC filter. |
|---|
In Fig. 9 we showed the current paths when the generator current was directed downward, and asked you to draw the paths when it was directed upward. In Fig. 10 we have done that case for you, so you can check your previous answer. Notice that during both half cycles the current through the resistor is directed downward in the diagram. That is the purpose of a rectification circuit, to convert AC to DC.
There's important detail to be observed here:
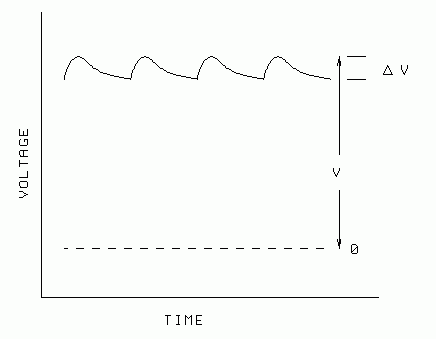 |
| Fig. 11. Ripple. The ripple factor is ΔV/V. |
|---|
a) What is the DC output voltage compared to the peak voltage of the AC input?
b) The 'ripple' is the small variation in the DC output voltage. You may need to switch the scope input to an AC setting, then increase the vertical gain to observe and measure the ripple. What is the ratio of the 'ripple' voltage compared to the DC output voltage? [This is called the ripple factor.]
                ΔV
Ripple factor = ——
                 V
c) The ripple is due to the capacitor's discharge during each half cycle. Use this fact to interpret the shape of the ripple you observe. Is its shape consistent with the value of R' and C you are using? Explain this in your report.
D. Direct display of diode characteristic curves. If you have an oscilloscope which permits input of an external signal to the horizontal axis, you can display a graph of the diode's characteristic curve directly on the screen. The circuit, Fig. 12, has some resemblance to that used in part A.
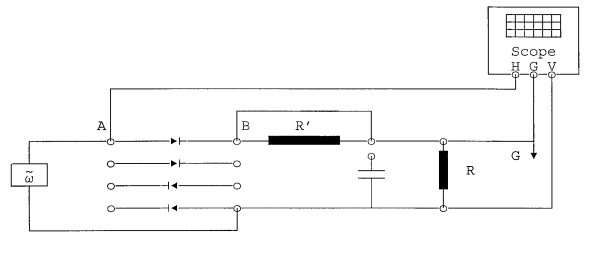 |
| Fig. 12. Direct display of I vs. V. characteristics. |
|---|
Notice particularly that the ground lead of the oscilloscope is connected differently than it was before. [You must, as before, avoid the 'common ground' problem by 'lifting' the ground of the signal generator's power cord.] The oscilloscope must be set for external input to its horizontal amplifier. The internal time-base generator is switched out and the voltage AB, across the diode, drives the horizontal deflection of the oscilloscope display. Consult your instructor if you do not know how to set the scope's controls to accomplish this.
In this arrangement the vertical axis plots a voltage proportional to the current through resistor R, which is the same as the current through the diode. The horizontal axis plots the voltage across the diode. So you will expect to see a graph of diode current vs. voltage on the scope screen, looking much like Fig. 3.
Sketch a graph of what you observe on the scope screen, and correctly label the current and voltage axes. Your sketch should accurately show details of shape, with respect to the grid lines of the scope screen. Use quadrille paper for accuracy and convenience.
Appendix: Forward and Reverse Resistances.
Alternate procedure to use if the appropriate equipment is available.
5. If you have an ohmmeter designed to safely measure resistance of diodes you may use it to measure the forward and reverse resistance of the diodes on the component board. Such a meter must have an ohmmeter current small enough that it cannot damage the diode. Do not assume a meter is capable of this until you have checked its instruction manual or have measured its ohmmeter current yourself. Consult your instructor if in doubt. A diode which measures a fraction of an ohm in both directions is defective (shorted). A diode which measures a very high resistance in both directions is also defective (open).Procedure steps 6 and 7 are an another way to measure forward and reverse resistances of diodes. Even if you have measured these with an ohmmeter, the following steps should be performed for their instructive value, and to gain experience in interpreting measurements made with the oscilloscope.
All of the diodes on the component board are identical, within manufacturing tolerances. In steps 6 and 7 you will determine the forward and reverse resistance of the typical diode by connecting diodes in pairs. When two identical diodes are in series, reversed, the pair has a resistance nearly equal to the reverse resistance of one diode. When they are connected in parallel, but with opposing polarity, their resistance is nearly the same as the forward resistance of each diode. Explain why this is so, with appropriate diagrams.
6. Reconnect the circuit board as shown, so that two diodes are in parallel with opposite polarity (in place of the single diode you used before). Measure voltages (with the oscilloscope) at A and at B as before. Using the known value of the resistor R, compute the forward resistance of the diodes.
 |
| Fig. 13. Circuit board connections and circuit diagram. |
|---|
7. Reconnect the circuit as shown below. The two diodes are in series, but reversed. Compute or estimate the reverse resistance of the diodes.
 |
| Fig. 14. Circuit board connections and circuit diagram. |
|---|
IMPORTANT NOTE: In parts C and D the ground leads of the oscilloscope and the signal generator must not be in common. If both instruments have one of their terminals internally connected to the electrical "safety" ground, then they are in common. Look to see if either instrument provides a simple way to eliminate this ground connection. If there is none, then the solution is to "lift" the safety ground of the power cord of the signal generator. Use a "grounding adap- ter", but leave its ground tab (or grean lead) unconnected. Consult the instructor before doing this.
V: QUESTIONS:
1. The load resistor R and the filter capacitor C serve several purposes simultaneously in this experiment, in addition to being part of the filter circuit. What are they? Hint: Consider what would happen if the resistor and capacitor weren't in the circuit? What if R were replaced by a short circuit?
2. Were the filter components of 10 ohms and 30 mF a good choice for the 60 Hz frequency? Hint: Compare the time constant of this RC combination with the period of the full-wave rectified waveform. Sketch the filter's output waveform compared to the full-wave rectified waveform, and identify specifically how the time constant affects the output waveform.
3. Would a larger filter capacitor, say 500mF give better filtering? Discuss the advantages and disadvantages of using a large value of filter capacitance.
4. Would a larger filter resistor, say 1000 ohms, give better filtering? Discuss the advantages and disadvantages of using a large value of resistance in the filter.
5*. When two identical diodes are in series, reversed, the pair has a resistance in either direction nearly equal to the very high reverse resistance of one diode. When they are connected in parallel, but with opposing polarity, their resistance in either direction is nearly the same as the very low forward resistance of each diode. Explain why this is so, with appropriate diagrams.
Text and diagrams ©: 1995, 2004 by Donald E. Simanek.
