L-8 WAVELENGTH OF LIGHT
 |
| Spectrum of white light. |
|---|
1. PURPOSE:
To determine the grating space of a plane transmission grating and to use this information to measure wavelengths of spectral lines.
2. APPARATUS:
Replica grating, electrical discharge tubes (sodium, mercury, hydrogen, helium, argon, neon), grating holder, power supply and mount for discharge tubes, 2 to 4 K-ohm rheostat.
METHOD 1 requires: spectrometer (same kind as used in L-4).
METHOD 2 requires: optical bench, scale with slit, light shield.
Note: Replica gratings are made by pouring a film of liquid collodion on a standard metal grating. When the liquid "sets" it is carefully lifted off as a sheet and laid on a sheet of glass. This film is fragile, and shouldn't be touched or abraded. Do not attempt to clean them.
Note: The diffraction grating is misnamed. The process which produces the spectra and which is responsible for the relation used in the measurements is interference. Diffraction occurs, of course, but plays only a secondary role in the use of the device.
3. PLAN OF THE EXPERIMENT:
The experiment consists of two parts: (A) determination of the grating constant (the number of lines per unit length), and (B) use of this grating constant to determine the wavelengths of "unknown" spectral lines.
Well-known spectral lines may be used to calculate the grating space, d, from the grating equation:
| [1] |
|---|
nλ = d sin(θ)
where λ is the wavelength, θ is the angle of deviation of the spectral line, and d is the grating space, in the units cm/line. The grating constant is defined as 1/d in the units lines/cm. Well-known lines which are reasonably bright and easy to identify are found in the spectra of sodium, mercury, and helium:
SODIUM: 5890, 5896 A, yellow pair ("doublet")
MERCURY: 5461, green; 5770, 5791, yellow pair
HELIUM: 5876, yellow
These may be taken as "known" or standard lines. Tabulations of wavelengths of other lines of these and other sources will be found in the appendix of this lab manual, and also in the Handbook of Chemistry and Physics. Such tables often list relative brightness of lines for particular types of sources. Relative line brightness depends on the source excitation method, and the temperature, pressure and other conditions in the source, so do not expect the brightness you observe to agree with those in tables.
CAUTION: The spectrum tubes are fragile and relatively expensive. Be especially careful when removing them from the cardboard storage tubes, for there is a fragile glass protrusion from the side of each.
CAUTION: The spectrum tubes are not intended for continuous operation. Their manufacturer recommends that for longest life they be operated only for 30 seconds followed by a similar cooling period. The spectrum tubes can get hot, especially at their narrow neck. Avoid touching the glass with your fingers.
CAUTION: Do not touch the high voltage electrodes of the spectrum tube power supply. Though the voltage is high, the current is low, and won't kill you. But it won't feel good if you should accidentally touch exposed parts of the circuitry. Turn off or unplug the power supply when you must change or adjust the spectrum tubes.
CAUTION: The replica grating is very easily damaged by abrasion. Do not let anything touch its surface.
NOTE: The rheostat (adjustable resistor) is used to control the brightness of the spectrum tube. Since the useful life of the tube is shortened by operation at full brightness, keep the brightness low during the experiment. If the lines are bright enough to see clearly that is all that is necessary. Making them brighter also broadens the lines and decreases the accuracy in determining their position.
4. PROCEDURE:
 |
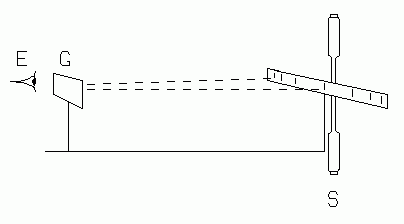
| Fig. 1. The diffraction grating, using the slit and scale method with an optical bench. |
|---|
METHOD 1, SPECTROMETER. Collimate the spectrometer as done in Exp. L-7. Place the grating on the center table, perpendicular to the rays emergent from the collimator. If you are using a grating which is mounted on glass, be sure that the side on which the grating is mounted faces away from the collimator, so that the light passes through the glass before passing through the grating.
The spectral orders are then observed with the telescope, and the angular deviation of each spectral line from the zeroth order is directly measured, both left and right. The deviation of a given line in a given order should be the same on the left as it is on the right. If it is not, the grating is not perpendicular to the incident beam, and readjustment is necessary. Small differences are tolerable, and may be treated by finding the difference between the left and right readings and dividing it by two.
 |
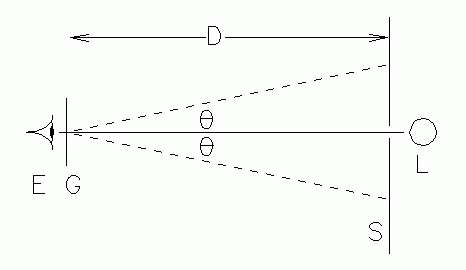
| Fig. 2. Top view of the slit and scale apparatus. |
|---|
METHOD 2, OPTICAL BENCH. Set up the apparatus as shown in Figs. 1 and 2, keeping the grating-to-scale distance, D, as long as possible for accuracy. The metric scale, S, is a special one with a narrow slit at its center. The light shield behind the scale blocks unwanted light. Look through the grating at the scale and observe the bright spectral lines, projected as virtual images onto the scale. Provide white light illumination for the face of the scale if the markings cannot be clearly seen. You should see several spectral orders on either side of the slit. The deviation of a given line in a given order may be read by noting where that line appears on the scale. These deviations should be the same size left and right of the slit. If they are not, the scale or grating, or both, are not perpendicular to the bench axis, and readjustment is necessary. Small differences are tolerable, and may be treated by averaging the left and right deviations. Calculate the deviation angle for each observed line.
(1) Calibration. Measure the deviations of known and unknown spectral lines in several orders right and left of the zeroth order, using whichever method is appropriate to the apparatus available:
(2) Measurement of unknown wavelengths. Obtain another spectrum tube (an "unknown") and measure the angular deviations of its prominent spectral lines. Calculate their wavelengths. Consult handbook data for gas discharge wavelengths and try to identify the gas in this spectrum tube.
(3) Spectrum of sodium. If time permits, try to see the spectrum of table salt (sodium chloride.) Set up a bunsen burner as a source. Observe its spectrum. Are there any spectral lines? Do you see anything else about the spectrum worthy of comment? Now drop a small pinch of salt into the flame while observing the yellow region of the spectrum. The hot salt will give off the familiar yellow sodium doublet. This might be most easily observed by holding a grating up to the eye as you look at the flame through the grating.
(4) Absorption Spectra. [May be done if gas samples are available.] See if you can observe the absorption lines of a cool gas. Let white light from an incandescent lamp pass through a glass container of the gas, and see if you can notice any "dark" lines in the spectrum of the lamp.
5. ANALYSIS OF DATA
(1) Devise a valid and efficient weighted averaging procedure for using the data for all observed "known" lines to calculate one "best" experimental value of the grating constant. Compare this with the value obtained in part (1), if that part was performed. Which of these two values has the least experimental error?
(2) Devise an averaging procedure for calculating one "best" wavelength for each "unknown" line, from the data of each line's deviations in the several orders, left and right. Compare these results with tabulated values.
6. QUESTIONS
If you cannot "puzzle" out the answers to these questions by yourself, a little digging in optics books in the library may give you some clues.
(1) What would happen if the grating were not placed exactly at right angles to the collimated beam? Would there be any experimental advantage to doing this? Any disadvantages?
(2) A grating may be thought of as a regular array of transmitting "slits" with opaque space between them. Sometimes gratings are made in which the opaque space between the slits is exactly equal to the slit width. What effect does this have on the observed spectrum? In particular, which "orders" will be seen and which will not be seen? You must consider the fact that diffraction and interference are both happening to the light passing through a grating.
(3) The instructions stated: "If you are using a grating which is mounted on glass, be sure that the side on which the grating is mounted faces away from the collimator, so that the light passes through the glass before passing through the grating." If you have previously done the prism spectrometer experiment you observed that the spectral lines were curved. If you hadn't followed the instructions, but instead placed the grating surface facing the collimator, you will see a slight spectral line curvature. Why does this happen?
(4) It is obviously important to have the grating perpendicular to the collimated light. But what about the placement of the grating on the spectrometer table. What if the grating were, say 1 cm displaced from the center of the table, toward the collimator? How much error would this introduce into your measurements? Be quantitative. Remember that the telescope rotates around the center of the table, and this is also the center of the scale with which you measure angles.
(5) Why are the higher orders less bright? Before you answer, consider the fact that some gratings are made in which the second order is brighter than the first order spectrum. How could this be accomplished?
(6) Suppose the effective area of the grating were reduced, say by covering all but the center with opaque paper. How would this affect your measurements? Would they be as precise? As accurate?
(7) Figure 2 is schematic and simplified. It doesn't show the details of all of the light rays from the slit to the retina. In particular, there's a cone of rays which reaches the eyelens, its diameter limited by the eye's pupil. As you noticed, one must look in a different direction for each of the spectral lines. Show a picture with these details, and discuss how this can introduce both indeterminate and determinate error into the results.
(8) If a grating with smaller grating space (larger grating constant) is used, how are the observed angles or spread of the spectra affected?
(9) Did you observe any difference in the accuracy of the determination of the wavelengths of the mercury lines for the different order spectra? If so, give an explanation.
(10) Is it possible for part of the first-order spectrum to overlap the second-order spectrum? Explain, assuming a continuous spectrum.
(11) What is the highest order of the spectrum one can observe from a particular diffraction grating? Justify your answer mathematically.
Wave lengths of prominent spectral lines may be found in experiment L-7.
Text and line drawings © 1996, 2004 by Donald E. Simanek