P-3 SIMPLE PENDULUM
1. PURPOSE:
(1) To illustrate an important experimental technique: isolation of variables to study the relation between a pair of variables by holding all others constant,
(2) To introduce graphical analysis with log-log paper as a tool for determining the relation between variables.
(3) To investigate the physical quantities which influence the period of a pendulum, and to determine the functional dependence of period on some of these quantities.
2. BACKGROUND:
Read Ch. 7 of An Introduction to Experimental Analysis, and especially Sec. 7.8 on the use of logarithmic graph papers. You won't need any textbook knowledge of the physical theory of pendulums. You can read that theory after the experiment.
3. STRATEGY:
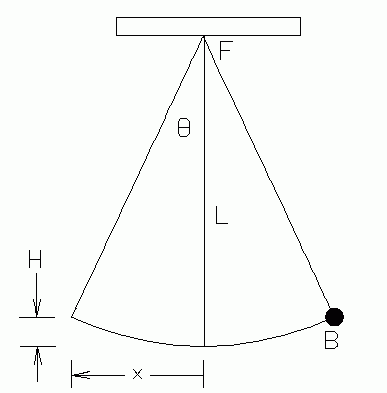 |
| Fig. 1. The pendulum. |
|---|
The simple pendulum consists of a small bob (weight) B on the end of a string secured on a rigid support F (the fulcrum). The bob is pulled aside a distance x and then released, allowing it to swing in a an arc. The time the bob takes for one complete swing is called its period.
Though many books give equations for the period of a simple pendulum, we will pretend that we don't know the equation, and try to "discover" it through experimentation.
The pendulum's period is is the time it takes to swing from one side to the other and return to its starting point. This may be easily determined with a stop-clock by counting a number of complete swings, say n, and dividing the total time by n.
We suspect the period could depend on at least the following factors: (1) mass of the pendulum bob, (2) shape of the bob, (3) volume of the bob, (4) length of the suspension string, (5) air resistance (drag) on the bob and string, (6) size of the swing (amplitude), (7) Size of the gravitational force.
You have no means to change the gravitational force in our laboratory, so we must leave this variable for others to investigate, perhaps by doing the experiment on a high mountain as well as at a lower elevation. You have no practial way to investigate the effects of air resistance; but these will be small compared to experimental errors. The effect of air drag causes a noticeable slow decrease in the amplitude of swing as time goes on. The remaining factors are easily investigated.
4. EQUIPMENT:
Pendulum bobs of equal radius, but different masses, made of cork, wood, brass, steel, etc.; string, one- and two-meter sticks; electric stop clock; balance scales; goniometer (on the back of this lab manual); 2 x 1 cycle log-log graph paper.
5. PROCEDURE:
To simplify and systematize the data-taking and analysis, confine your experimental values for pendulum length to the values
15, 30, 60, 100, 200 cm
or:
20, 40, 80, 150, 300 cm
depending on the maximum length of pendulum your laboratory situation can accomodate. Investigate at least five or six different lengths.
Use values of amplitude angle of
5, 30 and 80 degrees,
measured from the vertical.
The amplitude may be expressed in several ways: (1) the maximum height H attained by the bob; (2) the maximum horizontal displacement X; or (3) the maximum angle of displacement q. All of these are measured from the lowest point of the bob's motion. In terms of the suspension length L, these are related by tanq = X/(L-H). See Fig. 1 for the geometry.
In each case, time enough swings for a time interval of at least 20 seconds, to determine the period of the pendulum's swing.
(1) Attach a string to a rigid support high above the floor. Suitable attachment points may be provided in the lab ceiling. The attachment point must be solid so that it does not shift position as the pendulum swings.
(2) ln all cases set the pendulum into motion so it swings in a fixed vertical plane. Avoid oval paths, because they introduce other variables which are hard to control.
(3) Choose the largest practical value of string length (from the list above). Keeping this length constant, investigate the effect of bob mass on the period by successively testing each of the different bob samples provided. Use an initial amplitude of 5 degrees in all cases.
(4) Using the same string length, and the heaviest metal bob, investigate the effect of different amplitudes. Use the amplitude angle values from the list above.
(5) Use a metal bob and an initial amplitude of 5 degrees. Then try successively shorter string lengths. Use the length values from the list above. For the shorter lengths you will have to time more swings to keep the accuracy of the pendulum period comparable to that for the longer lengths.
(6) If time permits, compare the periods of a plane pendulum and a spherical pendulum with the same string length and the same bob. A spherical pendulum is one in which the bob swings in a perfect circle in a horizontal plane.
6. ANALYSIS:
The data will very likely show that the strongest dependence is that of the period on the string length. Plot the data for the metal bob: period versus length, on ordinary (linear) graph paper. The plotted points will lie on a curve. The direction of its curvature leads one to suspect that an equation of the form
| [1] |
T = K Ln
might describe the data, where K is a proportionality factor and n is an exponent less than one. We do not assume, as some lab manuals suggest, that n = 1/2, since that would be assuming something that we have not yet determined experimentally. We must find the value of n. This gives us a fine opportunity to get experience using semi-logarithmic graph paper.
(1) Take the logartithm of both sides:
| [2] |
log(T) = log(K) + n log(L)
(2) If this guess is correct, a plot of (log T) against (log L) should produce a straight line graph. Plot the T vs. L data on 2 by 1 cycle log-log graph paper. If the points do lie on a straight line, draw the best fit line with a ruler.
(3) Consider two well-separated points on the straight line, P1 and P2. Write Eq. 2 twice, once for each point.
| [3] |
log(T1) = log(K) + n log(L1)
| [4] |
log(T2) = log(K) + n log(L2)
Subtract Eq. 4 from Eq. 3.
log(T2) - log(T1) = n[log(L2) - log(L1)]
So, finally,
| [5] |
    log(T2) - log(T1)
n = —————————————————
    log(L2) - log(L1)


	Use this to determine the value of n.

	Also determine, from the graph, the value of K. Remember that K has units and
     dimensions. Express K in MKS units. From your procedure, estimate the error in each
     of these results.

	(4) Finally, examine the data to see whether the period depends on any other variables
     to a degree significantly larger than the experimental errors. State clearly what can be
     concluded about such dependences, from the data.

(5) An elementary textbook asserts that the period of a simple pendulum is given by the
equation:
| [6] |
T = 2π√(L/g)
where g is the acceleration due to gravity (about 9.8 m/sec). How well is your data in agreement with this equation?
(6) Using your value of the slope K from analysis section (3) and equation [6] determine the acceleration due to gravity, g.
(7) An advanced textbook asserts that the period of a simple pendulum is dependent on amplitude angle, q, and gives the equation for the pendulum period:
| [7] |
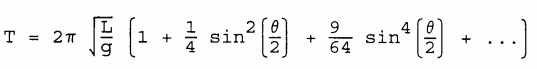
q is the maximum (initial) displacement angle of the pendulum bob, measured from the vertical.
The expression within the parentheses consists of an infinite series of terms, but we have omitted those too small to concern us here. Is the data in better agreement with this equation than with the one given in part (5) above? How small must the amplitude be for the two equations to be in agreement to 1%?
7. QUESTIONS:
(1) Use your graph to calculate the required length of suspension which would give the pendulum a period of 12 seconds.
(2) Why do you suppose we suggested that you use such a strange set of length values? (20, 40, 80, 150, 300 cm, etc.) What moral does this have for experimental analysis and strategy? If you had time to take twice as many measurements, what specific additional values would you choose?
 |
| Galileo Galilei (1564-1642). |
|---|
(3) Galileo Galilei (1564-1642) first noticed that the period of a pendulum is independent of amplitude, for small amplitudes. He observed a swinging chandelier in the Cathedral of Pisa [during a dull service, perhaps?] and timed the swings with his pulse. Later, in his Dialogue Concerning Two New Sciences (1638), he describes his understanding of the pendulum:
...I can easily measure the length of a string whose upper end is attached at any height whatever even if this end were invisible and I could see only the lower extremity. For if I attach to the lower end of this string a rather heavy weight and give it a to-and-fro-motion, and if I ask a friend to count a number of its vibrations, while I, during the same time-interval, count the number of vibrations of a pendulum which is exactly one cubit in length, then knowing the number of vibrations which each pendulum makes in the given interval of time one can determine the length of the string. Suppose, for example, that my friend counts 20 vibrations of the long cord during the same time in which I count 240 of my string which is one cubit in length; taking the squares of the two numbers, 20 and 240, namely 400 and 57600, then, I say, the long string contains 57600 units of such length that my pendulum will contain 400 of them; and since the length of my string is one cubit, I shall divide 57600 by 400 and thus obtain 144. Accordingly I shall call the length of the string 144 cubits.
Check Galileo's calculations against the results of your experiment. Has Galileo got his pendulum theory correct?
(4*) Continuing Galileo's discussion of the pendulum: In the same reference, Galileo writes "Nor will you miss it by as much as a hand's breadth, especially if you observe a large number of vibrations." Here Galileo is giving an estimate of the experimental error. Would you say his error estimate is reasonable? Explain, and state the conditions under which it might be reasonable, or unreasonable.
(5*) You probably noticed that the amplitude decreased with time. The rate of decrease was greater when the initial amplitude was greater. Air drag on the bob is the likely cause of most of this. From your laboratory experience, observations, and results, make some tentative, reasonable hypotheses about the effects you would expect air drag to have on the pendulum's rate of amplitude decrease.
To start you off on an appropriate manner of analysis: consider which of the following one might expect air drag to depend on:
a) bob mass,
b) bob radius,
c) bob volume,
d) length of the swing arc,
e) bob speed.
Of those you choose, what mathematical form would the dependence take? For example, if the dependence were on bob radius, would it be KR, K/R, K(R1/2), KR2, or what?
Note that some of these five variables may relate to each other in a simple manner, so your discussion may require only discussion of a few effects.
State your reasons for each hypothesis. See whether the hypothesis does predict what you observed, if the predicted size of the effect is larger than the experimental error.
This is an exercise in hypothesis formulation—intelligent scientific guessing. Hypotheses remain tentative until tested and confirmed by experiment. Even then they are only provisionally accepted, for their testing never ceases, as new experiments are devised.
(6*) Very often the pendulum departs from motion in a single plane and begins to move in an oval path. Suppose this happened, in a pendulum swinging in an arc of 50 cm, and developed a sidewise component of motion of amplitude 10 cm. Would this affect your results? Would this alter the measured period? If so, how much? If not, why?
Text and diagram © 1998, 2004 by Donald E. Simanek.